Bad news! You are losing your memory
Contents
That particular topic could be quite trivial for some of the engineers who deliver java applications as docker containers, but… If you’ve never cared about that particular thing, you’d better do it. Overwise, you will be losing a lot of memory in the container as unused.

As usual the pet project for the investigation could be found here.
Application for testing
First, I will create a simple application exposing controller for triggering the needed load inside the application to boost the heap rise. For that case, I use my favorite FakeLoad.
|
|
And FakeLoadExecutor is just a bean:
|
|
By the way, for checking jvm runtime properties I want to use metrics endpoint from Spring Actuator,
so let’s enable it too in application.properties:
|
|
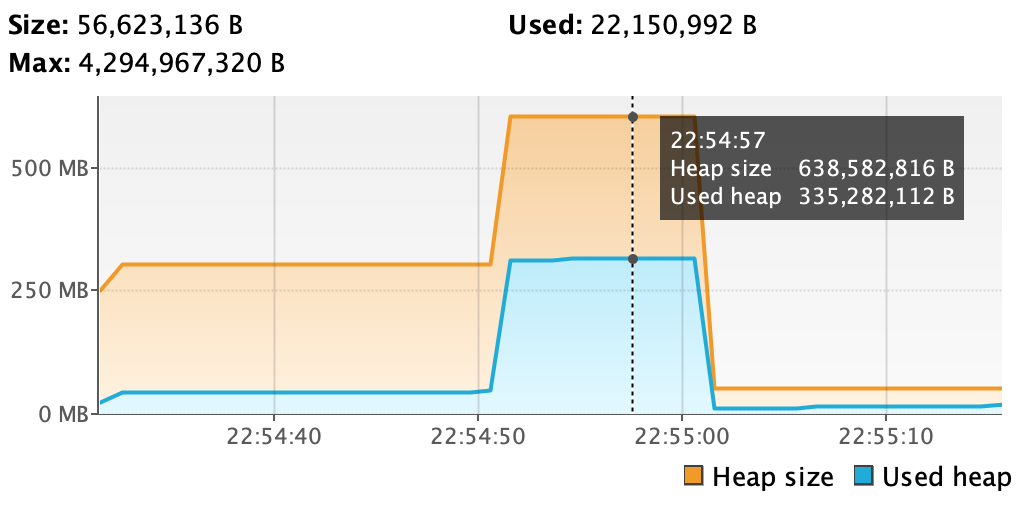
Now we almost ready to go, but let’s first check how the application works on my local machine. To trace the memory consumption, I am using the VisualVM application.
And the load with for 200 Mb memory consumption for 10 seconds:
|
|
produces this shape of heap memory:
Building image
Having the application to test, it’s time to build image and test it inside the container.
Although, Spring provides plugins for building images out of box (both in Maven and in Gradle).
I have created just a simple Dockerfile for the simplicity case:
|
|
Notice, the JAVA_OPTS environment variable usage, we would need it soon.
Building image:
|
|
Testing
Let’s just run with default settings and do some load:
|
|
First, we need to check how many memory we use and have in maximum for the heap?
|
|
|
|
|
|
|
|
|
|

Ok, what do we see from all of that? Our container has allocated about 2 Gb of memory, but the
heap for the running java application inside has only a quarter of that available: 517 Mb, about
17 Mb currently being used. That’s bad news actually, we have implied as it’s usually happening,
that this is a container only for our java application, we would like to have all the resources
inside of the container being consumed. If, for instance, I’ll do a load for 600 Mb memory, the
application should fail with the OutOfMemory exception, which is not nice having in mind that the
container has almost 2Gb of memory available. Let’s try:
|
|
Simple solution
That’s actually not “rocket science”, just to configure the heap size for the application, we can do
it via the JAVA_OPTS environment variable, which I noticed before. The problem here actually, is that
it’s really easy to forget about that tiny but crucial moment when rolling out a new containerized
application. Usually, all sorts of guides don’t bother too much about mentioning that, but the problem
happens on prod with a real load, and fixing that is usually not pleasant at all.
Running container with the right settings (you can use any of your choice - using percentages for example):
|
|
|
|
As we can see this time I have 1.5 Gb of memmory available. Let’s try the same failed load from the previous attempt:
|
|
and from parallel terminal during these 20 seconds let’s check the consumption endpoint:
|
|
|
|
This time, no exceptions, just the evidence of 600 Mb consumption.
Conclusion
Ok, I am not sure if anyone has learned something new in this article. But at least that could be a good reminding to all of you who deliver containerized applications to check if you actually wasting memory. Good luck!
Author Relaximus
LastMod 2021-08-15