Four cool things about Spring Actuator
Contents
I am going to quickly show some cool things, which could be done almost out of the box by means of Spring Actuator module. I selected just 4 cool features, but there are of course more.

Before getting started with cool things, I must warn you that big power brings also high responsibility. Don’t forget to check the security part of actuator documentation before delivering a solution to production.
Setup project
To show something we need a Spring project, I would need Spring MVC, Actuator, and Lombok to make life easier.
I showed already the Spring CLI in my previous article, I am going to use it
this time also:
|
|
Quite self-explainable, isn’t it? It’s a java project on Gradle.
As usual the projects with examples is hosted in GitHub repository.
Loggers
The first example is Loggers. Every modern application is using some kind of logging system. Usually, it’s configured in some files stored on the classpath. But look at what you can achieve with the Actuator loggers section.
Let’s define the level of logging for our application in the application.properties file:
|
|
At the moment you won’t see the loggers section in the actuator endpoint, as it’s not exposed via HTTP by default. Let’s open it:
|
|
To the default info and health sections, I added loggers. Now the root actuator endpoint
/actuator shows the loggers section also.
|
|
response:
|
|
Nice. But this is only part of the story. Let’s add some controller to the project, which only makes some logging on request.
DemoController:
|
|
As you noticed there is a DEBUG level for the logging, so calling the /push-log does nothing.
But what we can do is actually to change the level of the particular logger without stopping our application, on the fly. We need to send
a POST request to the same logger URL:
|
|
Now let’s try the call the logging controller:
|
|
The next line appears in the console:
|
|
Isn’t it what you were dreaming all the time, trying to find the cause of the bug, which appears only on production environments, but all the logging there is disabled.
Info
That was fun. But the fun is not finished. The next section is info. This is a user arbitrary section, which can be used for posting some custom information regarding the app. Well, you might think, what could be interesting the fully custom section, where I can put everything? The cool thing what tools coming out of the box with Actuator. In general, the whole framework trying to be as less config requiring as possible. And the next things prove this.
First, you can add the build info into the info-section. Add this in build.gradle:
|
|
If you want to pass some custom data from the Gradle project. The next code should be added to the same build.gradle:
|
|
The last section searches in the properties file of the application the placeholders and put there the appropriate data from the project. Having that, we can add the next lines to our application.properties:
|
|
And last but not least, let’s define the Spring component implementing InfoContributor interface:
|
|
This is the place where we can add any custom trash we want. Well, let’s check what we have in the info section of the actuator endpoint:
|
|
result:
|
|
Notice how effortless was that. But don’t push too much data into this section, it can become a heap of poorly structured data very quickly.
Health and custom levels
Saying about Actuator it’s hard to avoid a word about the health endpoint, which allows checking the status of the application in general.
There are two things which I wanted to mention here. First, Spring Actuator aggregates statuses from different subsystems of the
application in one final status. If you added the database support to the project and DataSource bean was created, spring boot will add
the health indicator for it. There are many such auto-indicators.
Second, if you didn’t find already existing health indicator, you can create your own pretty simple:
|
|
Here I am returning status WARMING on the first check of health, and then it’s again UP. That’s so easy now my indicator is participating in the aggregation of all system indicators in one general status. The only thing, which is left is to add my new WARMING status to the order in which, statuses being aggregated by default.
|
|
This means that if there are UP and WARMING the final status will be “WARMING”. And in the case of DOWN and WARMING, the last one is the total status of the application.
|
|
result:
|
|
and on the second request, status is:
|
|
Metrics
The last feature is the metrics. It allows you in just a few minutes to configure almost all crucial metrics collection for the app. Out of the box the long list of metrics frameworks and services supported. I’ll show the simplest example of in-memory metrics gathering coming by default with the core Micrometer package.
Ok, so what we need to do is first add the needed dependency in our build and expose the metrics endpoint.
In build.gradle:
|
|
and in application.properties:
|
|
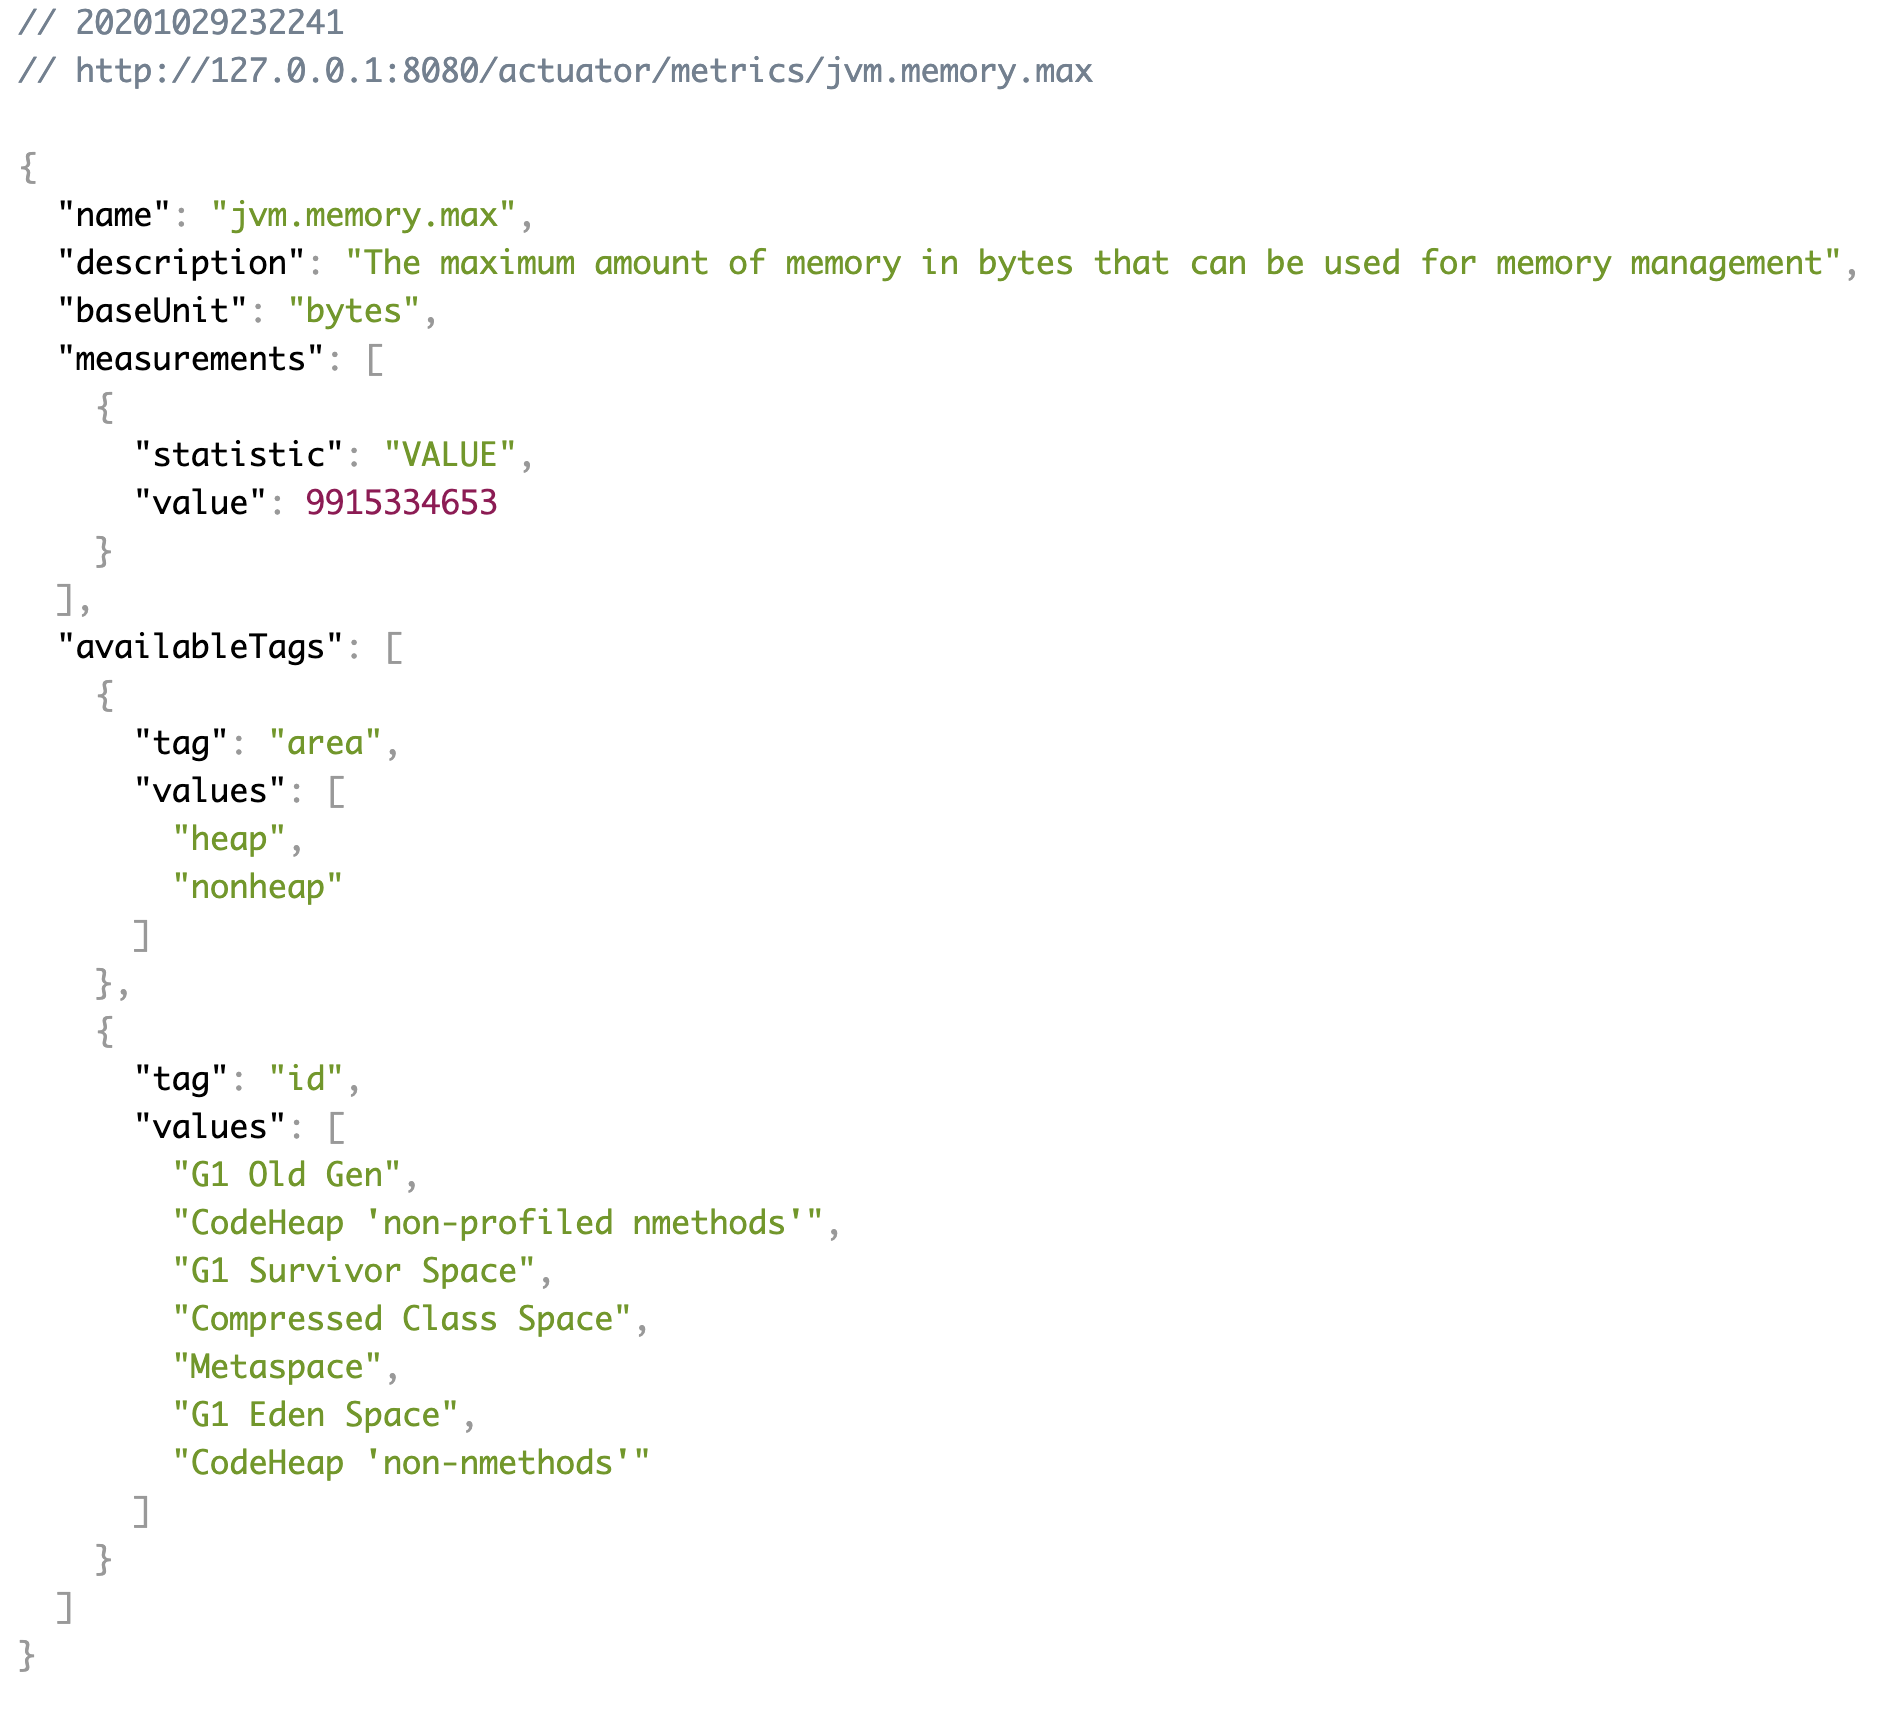
Now we are able to see the /actuator/metrics endpoint which returns the list of all available metrics to query. By default, out of the
box come to a lot of JVM specific metrics, for example:
Let’s try something a little bit more sophisticated. You can add your own tags to the metrics and query metrics by tag or other
parameters for the metrics as filters. Let’s do both:
DemoController:
|
|
Spring Actuator provides nice annotation @Timed to add custom info to the metrics. Here I have added the tag demo-tag to the push-log
controller created earlier. Let’s see what we have in the all request metric:
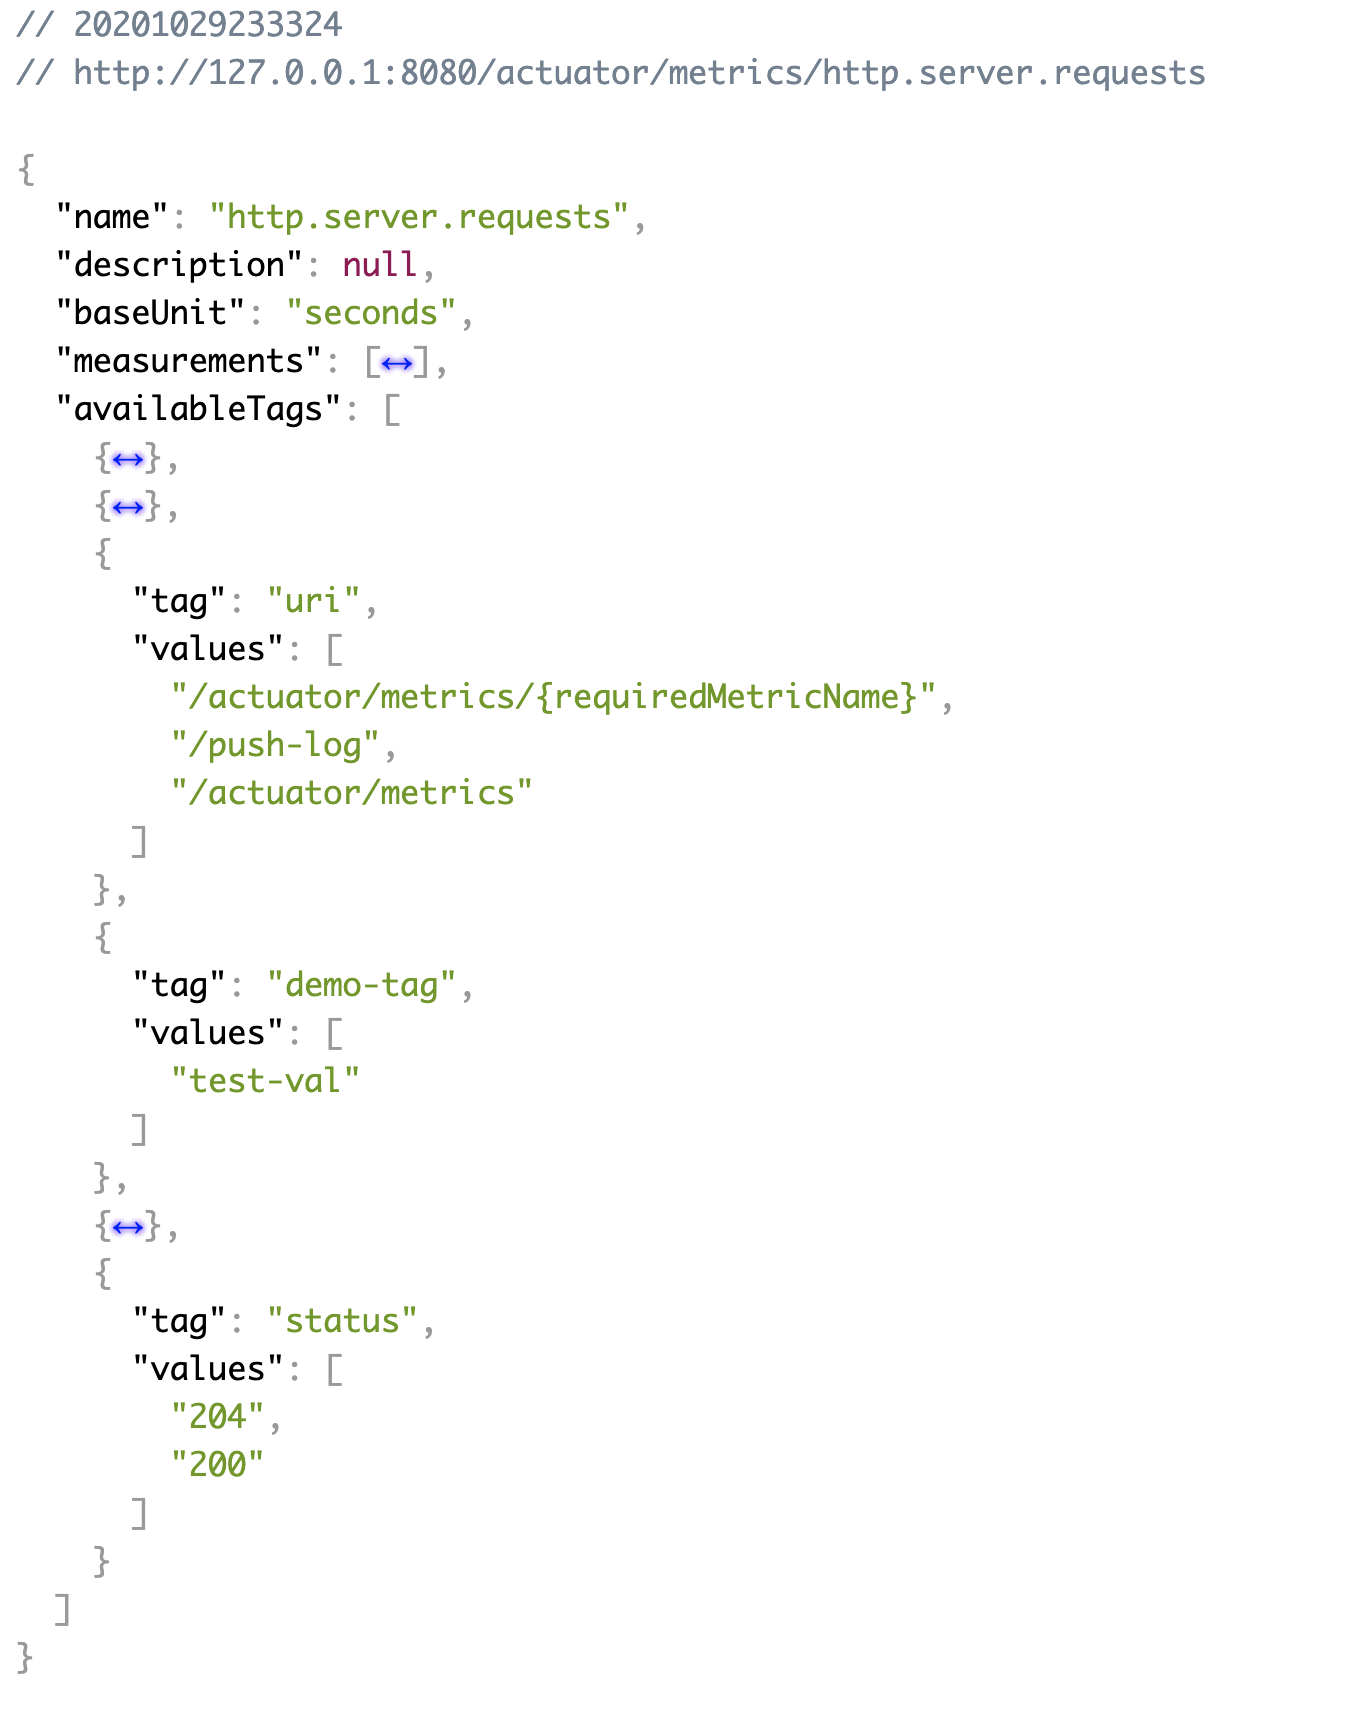
Let’s query metric for the specific request, for the /push-log:
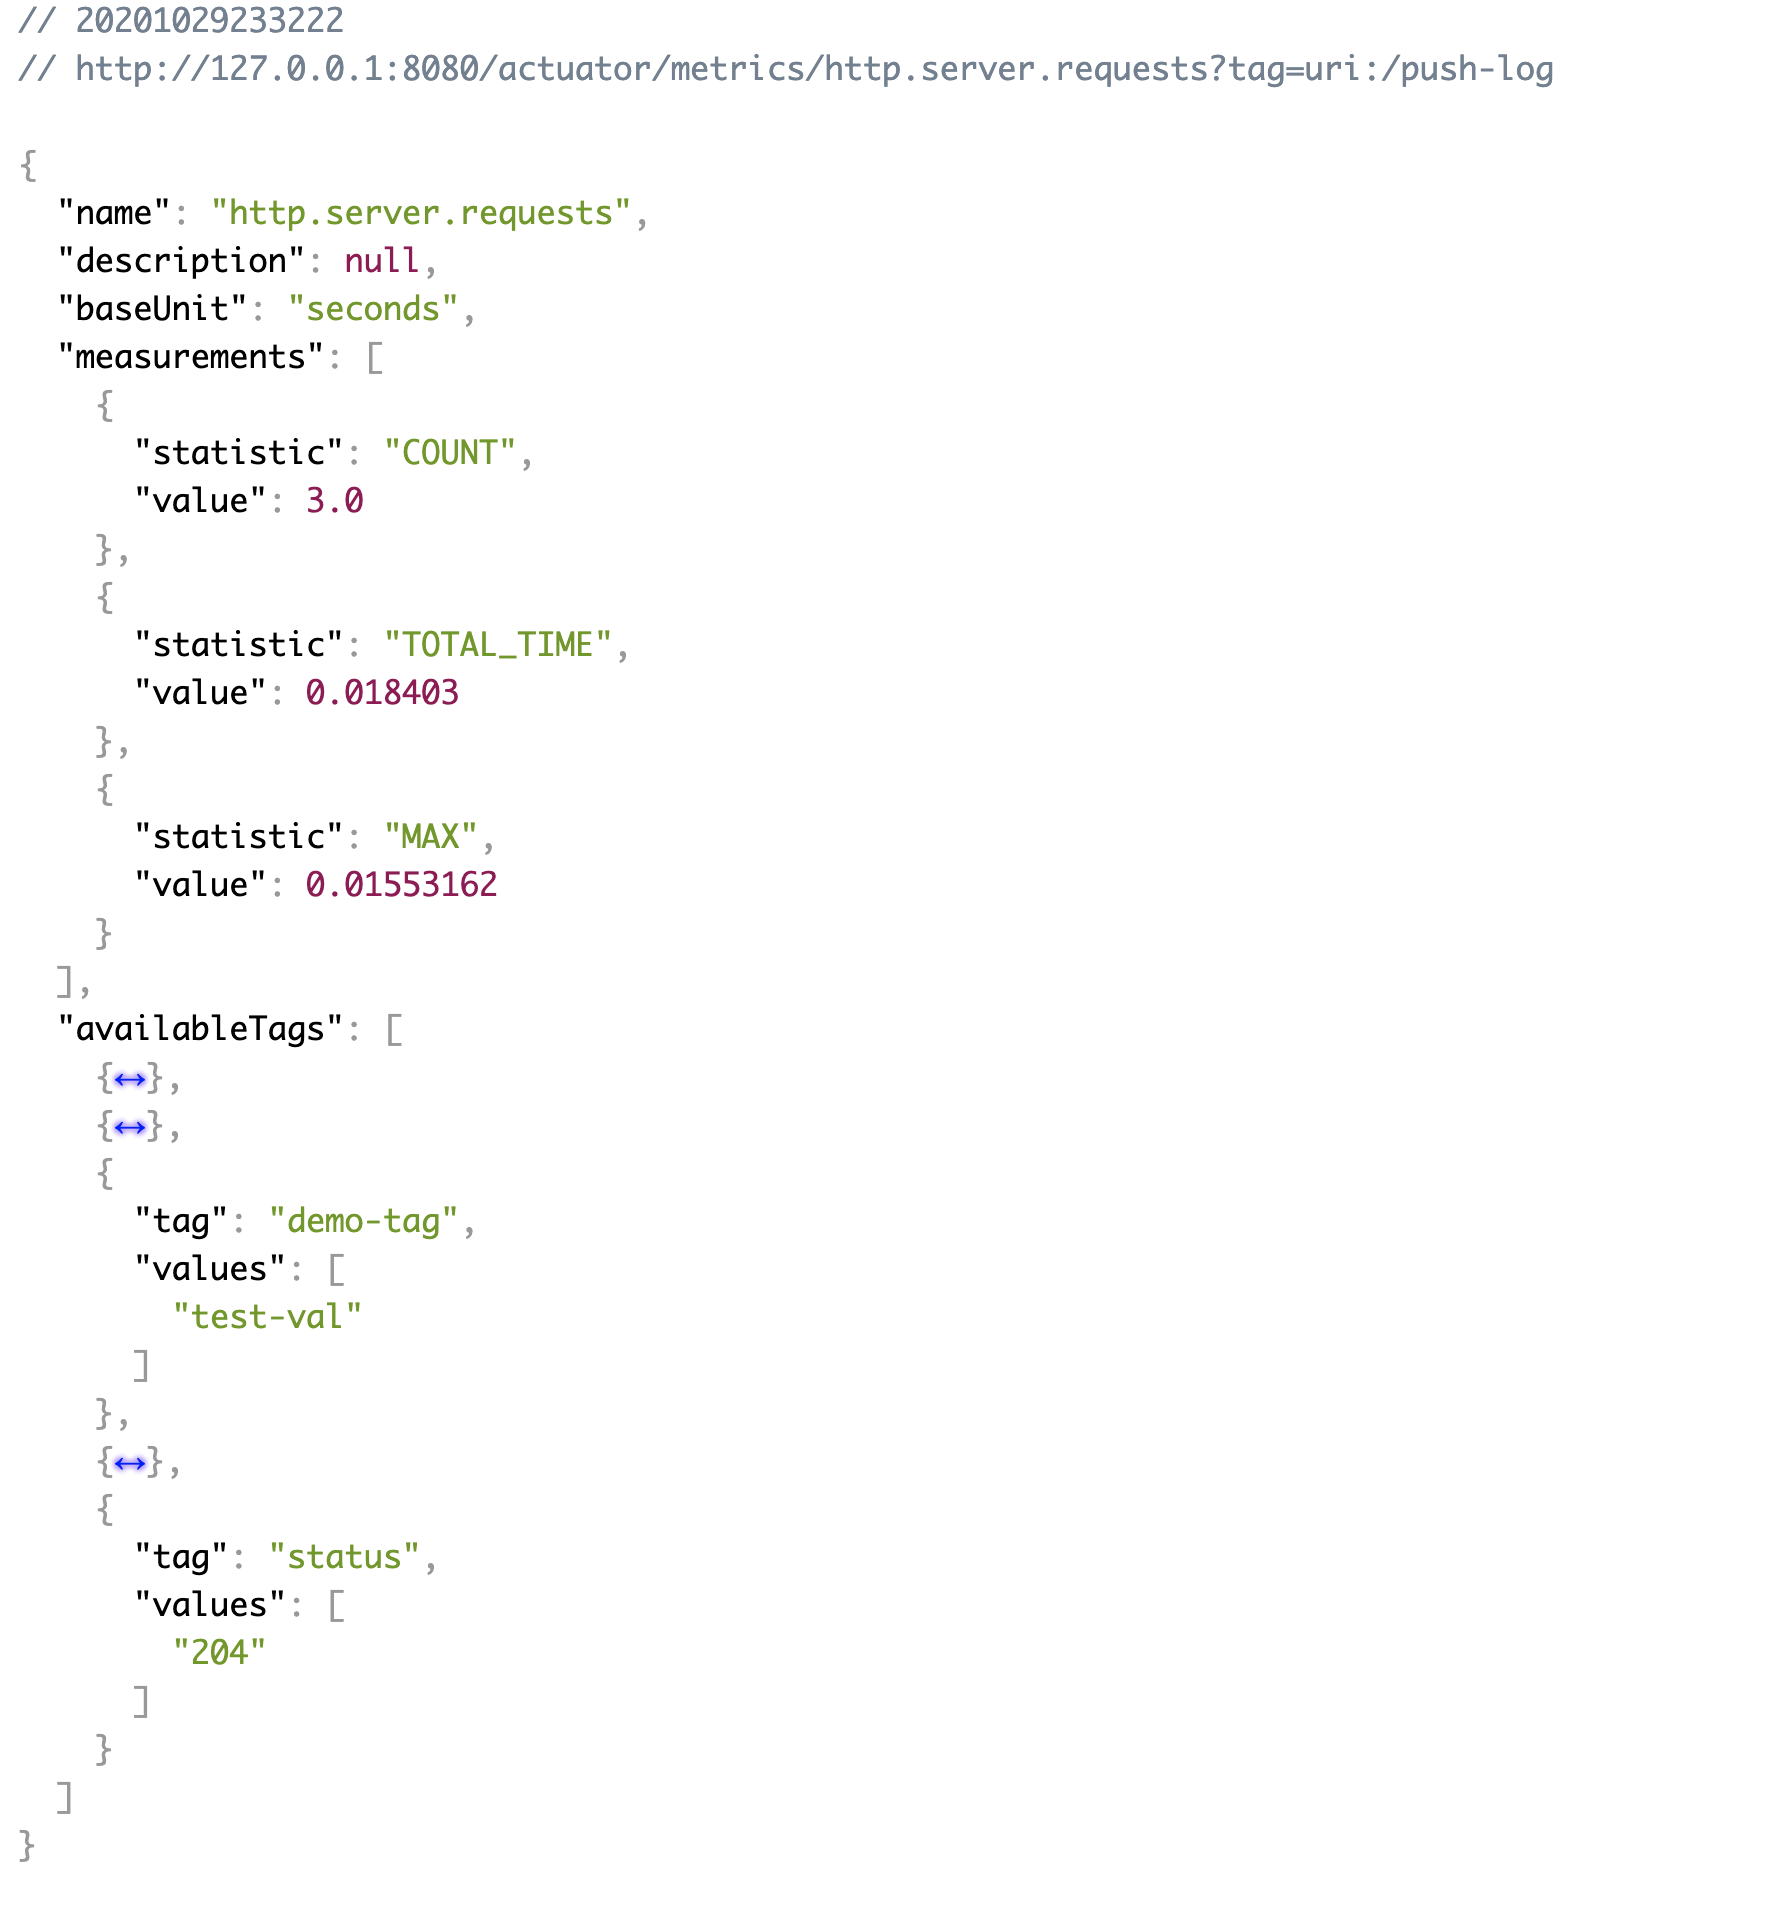
This is just an example of how metrics data being collected, for the production-ready solution you’d probably use some more advanced service, like Prometheus or datadog, but, in general, notice how less effort was applied here to start logging request metrics, for example.
Conclusion
Spring Actuator is really cool framework, but use it carefully.
Author Relaximus
LastMod 2020-10-27